

File:Resonance curve and Q.svg
Original file (SVG file, nominally 580 × 356 pixels, file size: 19 KB)
Summary
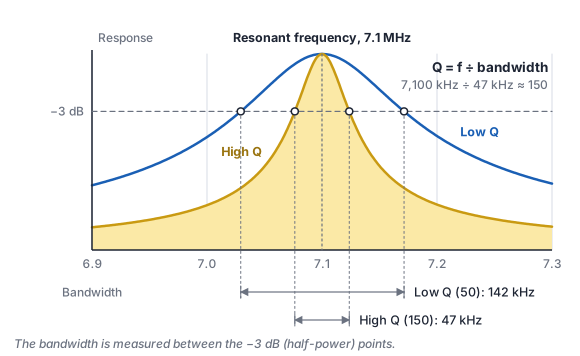
Response of tuned circuits at 7.1 MHz, scaled to the same peak: a Q of 150 gives a bandwidth of about 47 kHz between the −3 dB points, a Q of 50 about 142 kHz.
Source
Drawn for HamWiki.
File history
Click on a date/time to view the file as it appeared at that time.
| Date/Time | Thumbnail | Dimensions | User | Comment | |
|---|---|---|---|---|---|
| current | 22:57, 19 October 2026 | | 580 × 356 (19 KB) | HamWiki Editors (talk | contribs) | Diagram drawn for HamWiki |
You cannot overwrite this file.
File usage
The following page uses this file:
